This report is based on data collected and analyzed by the Sucuri Remediation Group (RG), which includes the Incident Response Team (IRT) and the Malware Research Team (MRT). It analyzes 9,000+ infected websites and shares statistics associated with:
The Website Hacked Trend report was first introduced in Quarter 1 of 2016. It was the first of its kind built from metadata collected by Sucuri’s Remediation Group (RG. This report will be more succinct and direct in its insight and expand on the data collected from previous quarters. All data will include updated data for 2016/Q2.
The one constant you’ll find in this report is the issues pertaining to poorly trained website administrators (i.e., webmasters) and their affect on websites.
This report will provide trends based on the CMS applications most affected by website compromises and the type of malware families being employed by the attackers. Additionally, we’ve introduced new data points around the number of websites blocklisted during the remediation phase and additional details into the makeup of the WordPress platforms.
This report is based on a representative sample of the total number of websites the Sucuri RG performed incident response services on in Calendar Year (CY) 2016 Quarter 2 (CY16-Q2). A total of 9,771 infected websites were analyzed in this report; a sampling that provided us with the most consistent data from which we could prepare this report.
Based on our data, similar to 2016/Q1 the three leading CMS platforms were WordPress, Joomla! and Magento. Again, this does not imply these platforms are more or less secure than others.
In most instances, the compromises analyzed had little, if anything, to do with the core of the CMS application itself but more with improper deployment, configuration, and overall maintenance by the webmasters and their hosts.
WordPress experienced a 4% drop from 78% in Q1 to 74% in Q2. Joomla! experienced a 2.2% increase from 14% in Q1 to 16.2% in Q2. All other platforms maintained a constant (with minimal change) distribution.
In Q2, 74% of the infected sites were built on the WordPress platform; a 4% decrease from Quarter 1. Similar to Q1, because of its relatively low numbers, Undefined, ModX and vBulletin are being removed from the rest of the report.
While the leading cause of infections stemmed from vulnerabilities found in the extensible components of the CMS applications, it’s important to analyze and understand the state of CMS’s in the websites we worked on. Out-of-date software has been a serious issue since the first piece of code was put to virtual paper. With enough time, motivation, and resources, attackers will identify and potentially exploit software vulnerabilities.
To make the data manageable, we’ve divided it into two distinct categories specific to the core of the application, not its extensible components:
A CMS was considered out of date if it was not on the latest recommended security version or had not patched the environment with available security updates (as is the case in Magento deployments) at the time Sucuri was engaged to perform incident response services.
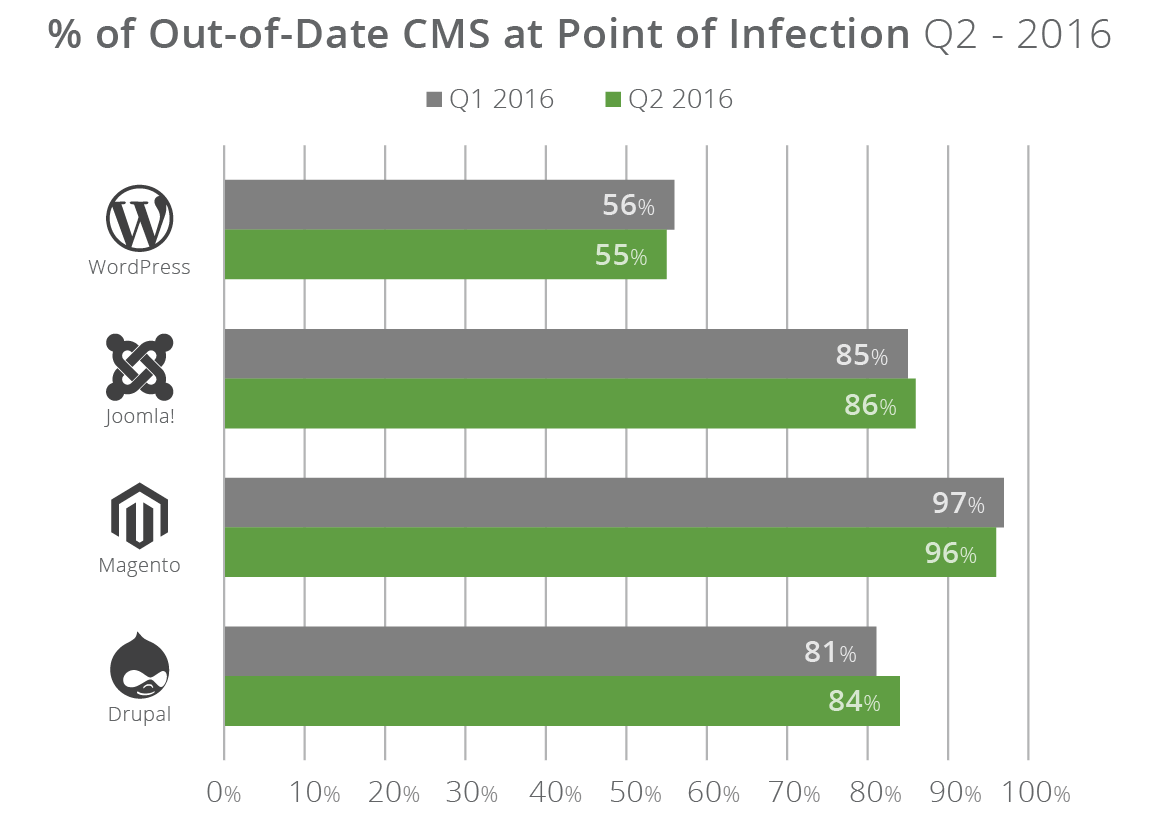
Based on this data, we saw a 1% improvement in the WordPress-based websites we worked on and a 4% increase in the Drupal installations that were out of date. It’s premature to say whether this is an indicator of improved website administration and an overall improved security posture by website owners, as these changes are all within an acceptable margin of error.
Similar to our findings in Q1, Joomla! (86%) and Magento-based (96%) websites lead the pack when it comes to the relationship between infected websites and poorly administered platforms. The challenge of being out of date stems primarily from three core domains: highly customized deployments, issues with backward compatibility, and the lack of staff available to assist in the migration. These tend to create upgrade and patching issues for the organizations that leverage them for their websites through incompatibility issues and potential impacts to the website’s availability.
Similar to Q1, we provide a deep dive analysis into the WordPress platform as it makes up 74% of our sampling. The top three WordPress plugins / scripts, continues to be TimThumb, Revslider, and Gravity Forms:
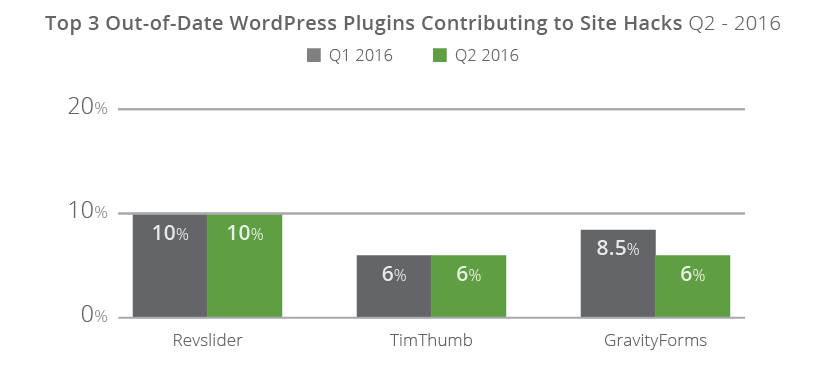
These were the top three out-of-date, vulnerable, plugins at the point in Sucuri provided incident response services:
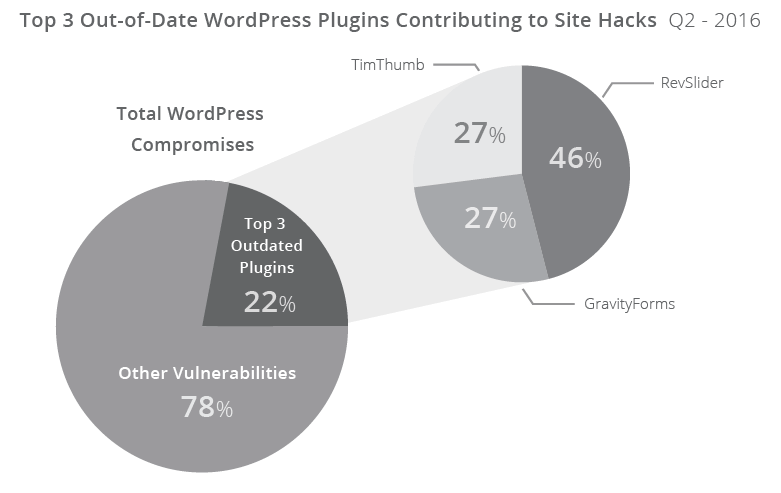
The most significant change came from Gravity Forms, in which we identified a 29% improvement in the plugins impact to infected websites. This can be for a number of reasons, most importantly,the total affected market has either been already addressed, actively patched or both. Again, it’s premature to jump to conclusions and we’ll continue to monitor this in the upcoming quarters.
All three plugins had a fix available over a year, with TimThumb going back multiple years (four to be exact, circa 2011). Gravity Forms was patched in version 1.8.20, December 2014 to address the Arbitrary File Upload (AFU) vulnerability that is causing the issues identified in this report. RevSlider was patched silently February 2014, publicly disclosed by Sucuri September 2014, and mass compromises started, and have continued, since December of 2014. This illustrates the challenges the community faces in making website owners aware of the issues, enabling the website owners to patch the issues, and facilitating the everyday maintenance and administration of websites by their webmasters. TimThumb was by far the most interesting revelation in the analysis, specifically that it’s still a significant player in today’s hacks.
Additionally in this report, we expanded our telemetry data to include information that may be of value to us as we analyze it over time. The first bit of data is the distribution of the most common plugins in the infected websites we analyzed.
Note: If any plugin % doesn’t match the overall plugin utilization, it is likely a red flag that it has some issues.
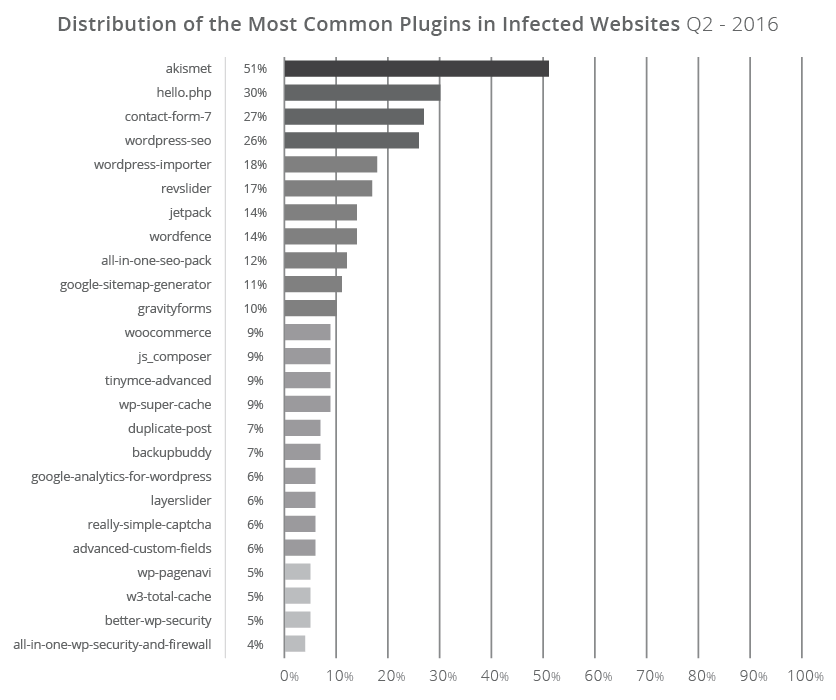
We don’t currently have a firm grasp on the plugin utilization across the entire spectrum of sites we analyzed, which makes the comparison harder, but it’s something we’re looking to improve in the upcoming quarterly reports.
On average, a compromised site has 12 plugins installed.
In our previous report, we missed an opportunity to include data on blocklists – specifically, which of the infected websites were blocklisted and by who. Understanding how blocklists work, and how they affect a website’s brand reputation is important and should be a data point every website owner should monitor.
A website being flagged by a Blocklist like Google can be devastating to a website’s functionality. It can affect how visitors access a website, how it ranks in Search Engine Result Pages (SERP) and also adversely affect communication mediums, like email. Per our analysis, approximately 18% of the infected websites were blocklisted. This indicates that approximately 82% of the thousands of infected websites we worked on were freely distributing malware and it highlights the need and importance of continuous monitoring of your web property.

In our scans we leverage a number of different blocklists. The most prominent blocklist was Google Safe Browsing; it accounted for 52% of the blocklisted sites (18%) which also happens to be 10% of the total infected sites we worked on. Norton and Yandex each had over 30% blocklist detection and SiteAdvisor had over 11% detection. All other blocklists we check flagged less than 1% and were removed from the report (including: PhishTank, Spamhaus, and a couple of smaller ones).
Note: The percentage will never be 100% as some sites were flagged by multiple blocklists at the same time.
Part of our research over the past quarter includes analyzing the various infection trends, specifically how they correlate to our malware families. Malware families allow our team to better assess and understand the attackers tactics, techniques and procedures (TTP), which inevitably leads us to their intentions.
A hacked site can have multiple files modified with different families of malware in them (a many-to-many relationship). It depends on the attacker’s intent or goal in how they plan to leverage their new asset (asset is the term used to describe the website that they have acquired and is now part of their network). On average, we cleaned 80 files per compromised site this quarter (different than the 160+ in Quarter 1).
Malware Family |
Description |
|---|---|
Backdoor |
Files used to reinfect and retain access. |
Malware |
Generic term used for browser-side code to create drive-by downloads. |
Spam-SEO |
Compromise that targets a website’s SEO. |
HackTool |
Exploit, or DDOS tools, used to attack other sites. |
Mailer |
Spam generating tools designed to abuse server resources. |
Defaced |
Hacks that leave a website’s homepage unusable and promote an unrelated subject (i.e., Hacktivism). |
Phishing |
Used in phishing lures in which attackers attempt to trick users into sharing sensitive information (i.e., login information, credit card data, etc.) |
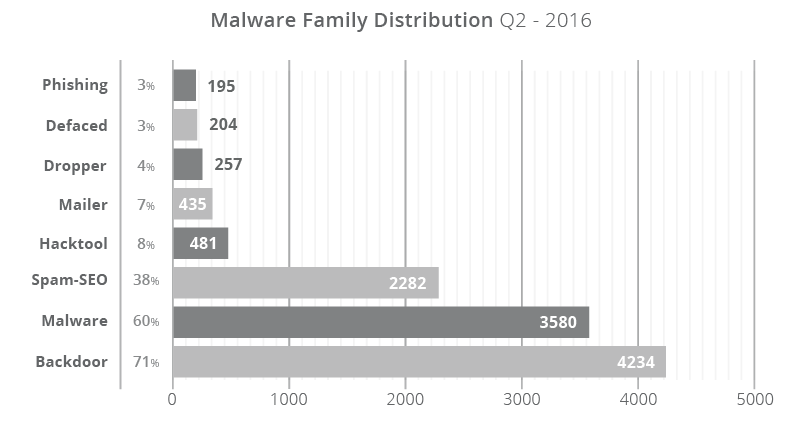
Over the course of the previous quarter, 71% of all compromises had a PHP-based backdoor hidden within the site; a modest increase from Q1 (4%). These backdoors allow an attacker to retain access to the environment long after they have successfully infected the website and performed their nefarious acts. These backdoors allow the attackers to bypass any existing access controls into the web server environment. The effectiveness of these backdoors comes from their illusiveness to most website scanning technologies. The backdoors themselves are often well written, do not always employ obfuscation, and present no external signs of a compromise to website visitors.
Backdoors often function as the point of entry into the environment, post-successful compromise (i.e., the ability to continue to compromise). Backdoors themselves are not often the intent of the attacker. The intent is in the attack itself, found in the form of conditional SEO spam, malicious redirects, or drive-by-download infections.
Approximately 38% (6% increase from Q1) of all infection cases are misused for SEO spam campaigns (either through PHP, Database injections or .htaccess redirections) where the site was infected with spam content or redirected visitors to spam-specific pages. The content used is often in the form of pharmaceutical ad placements (i.e., erectile dysfunction, Viagra, Cialis, etc.) and includes other injections for industries, like Fashion and Entertainment (i.e., Casino, Porn). SEO spam making up 38% of the infections we’re seeing is interesting, specifically because it’s not part of the warnings Google or any other search engines are reporting on.
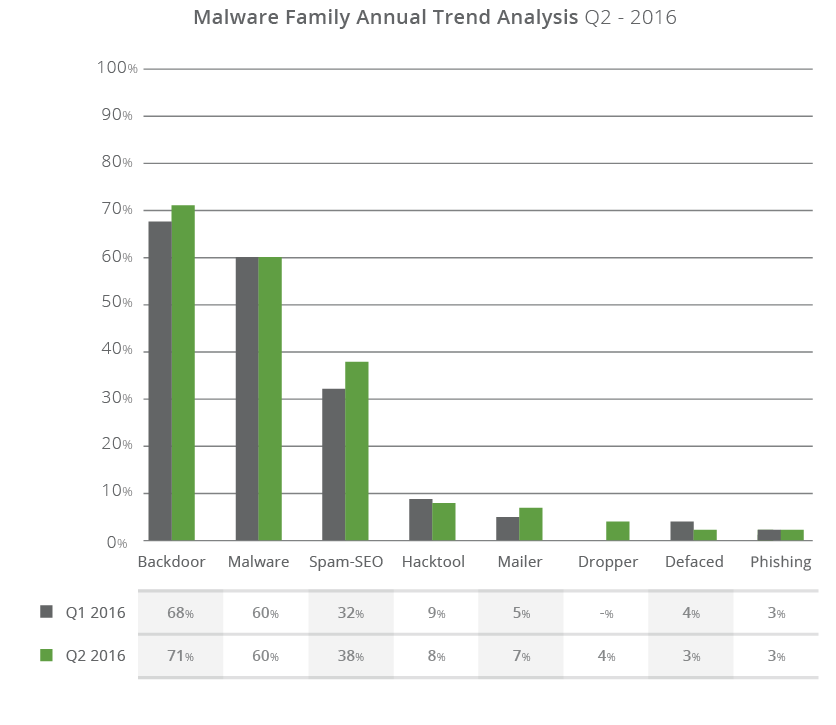
The number of defacements continued it’s downward trend (~3%) and speaks to the evolution of attackers and their TTPs.
This report confirms what is already known; vulnerable software continues to be a problem and is the leading cause of today’s websites hacks. While the data sampling was lower than expected, the relationship across the various domains analyzed were similar.
A few takeaways from this report include:
There is little in the data to indicate that there is any change occurring between the guidance being disseminated by information security (InfoSec) professionals and the actions website administrators are taking.
Similar to what we reported in Q1, we can expect that as open-source technologies continue to change the website industry we will continue to see evolutions in the way they are compromised. There is currently a sharp decline in the knowledge required to have a website, which is breeding the wrong mindset with website owners and service providers alike.
Thank you for taking the time to read our report and we hope you found it engaging and thoughtful. If there is any additional information you think we should be tracking and reporting on, please let us know. We have a number of new datasets we hope to be tracking for the Q3 report.